
You’ve measured your room and you can read the graphs. This guide gives you numbers to judge them against, from listening-room standards and published research, with what a problem looks like on each graph.
Check your results, graph by graph
Beginner
The standards below come from reference listening rooms used for critical listening. A home cinema or living room doesn’t have to meet them. Use them as a guide to what “good” means, not a pass or fail.
1. Frequency response
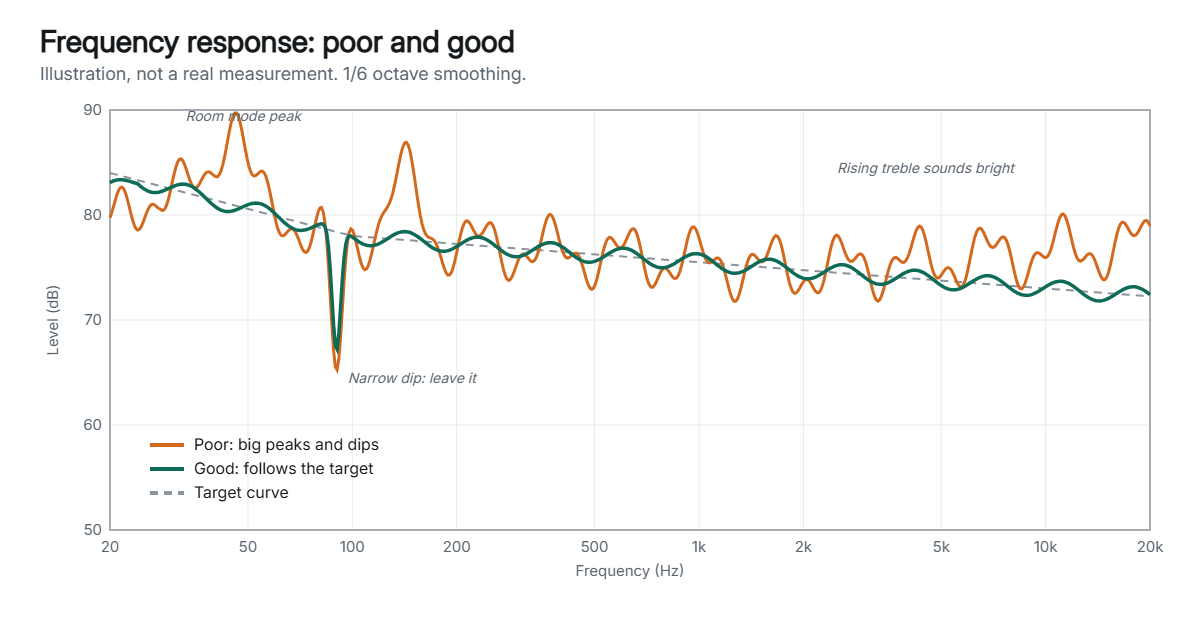
| Good | OK | Poor | |
|---|---|---|---|
| Overall shape | Smooth, with a gentle downward tilt of about 2 to 3 dB per decade from 100 Hz to 10 kHz | Mostly smooth with a few broad bumps | Flat or rising treble, or big steps between regions |
| Bass (below about 300 Hz) | Peaks and dips within a few dB of the target, except narrow dips | Some broad peaks left | Peaks of 10 dB or more; a gap at the crossover |
| Narrow dips | Left alone | Boosted by EQ (they rarely fill, and waste headroom) |
Sources: Toole’s in-room research, as summarised by audioXpress; ITU-R BS.1116 for reference rooms.
2. Bass decay (waterfall and spectrogram)
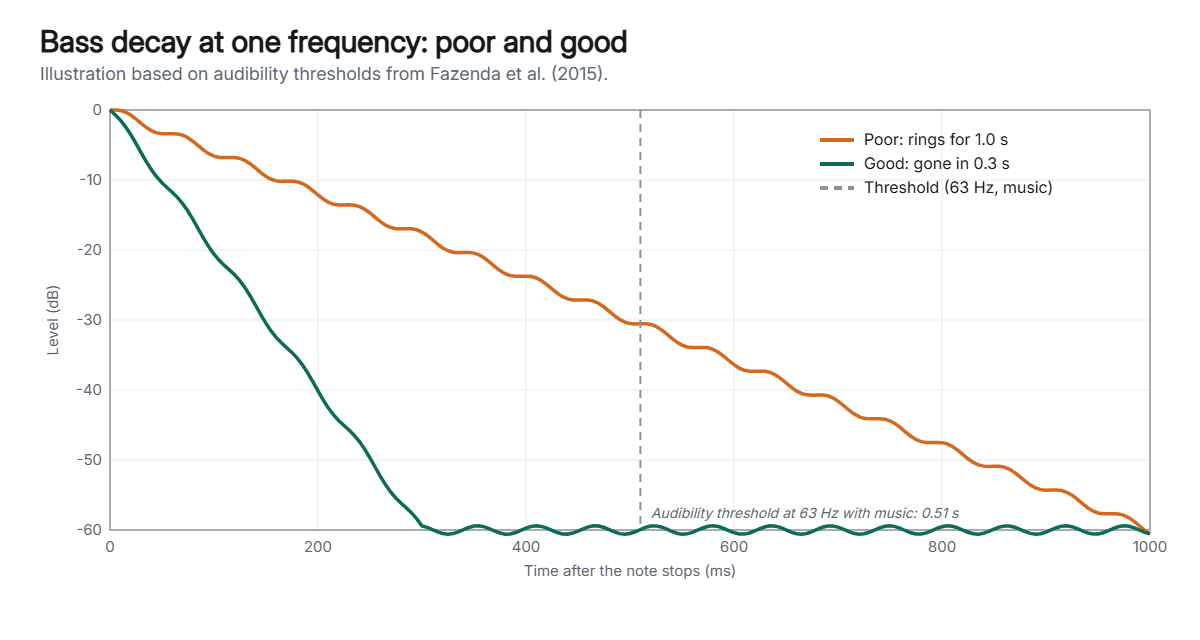
Research by Fazenda and colleagues found the point at which listeners start to hear a room mode ringing on. Below these decay times, a longer decay wasn’t noticed.
| Frequency | Audible above, with music | Audible above, with test signals |
|---|---|---|
| 32 Hz | Not tested | 0.9 s |
| 63 Hz | 0.51 s | |
| 200 Hz | 0.17 s | |
| 250 Hz | 0.12 s |
| Good | OK | Poor | |
|---|---|---|---|
| Decay at each bass frequency | Below the thresholds above | Close to them, with no single frequency standing out | Individual ridges clearly outlasting their neighbours |
How to read decay time on a waterfall: a frequency that takes 0.5 s to fall 60 dB falls 30 dB in about 0.25 s. Source: Fazenda, Stephenson and Goldberg, Journal of the Acoustical Society of America, 2015.
3. RT60
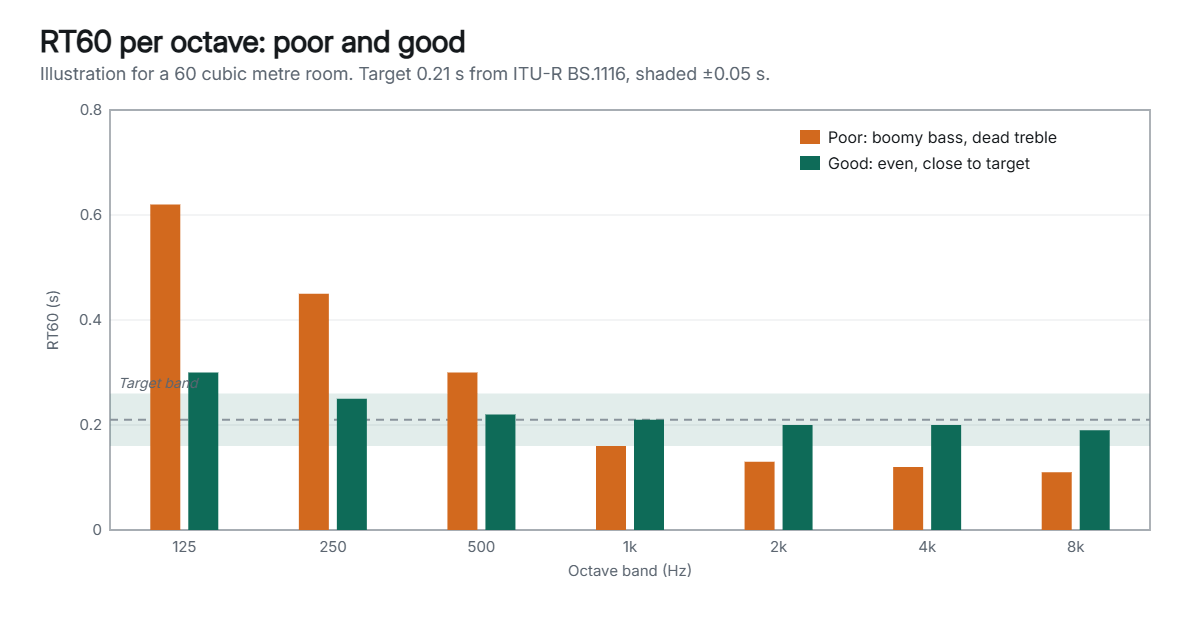
The listening-room standard ITU-R BS.1116 sets a target reverberation time from the room’s volume: Tm = 0.25 × (V / 100)1/3 seconds, where V is the volume in cubic metres. EBU Tech 3276 keeps it between 0.2 and 0.4 s. REW’s own guidance is about 0.3 s for rooms under 50 m³ and 0.4 to 0.6 s for rooms up to 200 m³.
| Room volume | Target Tm (ITU-R BS.1116) |
|---|---|
| 40 m³ | 0.18 s |
| 60 m³ | 0.21 s |
| 80 m³ | 0.23 s |
| 100 m³ | 0.25 s |
| 150 m³ | 0.29 s |
| Good | OK | Poor | |
|---|---|---|---|
| RT60 from 250 Hz to 4 kHz | Within about 0.05 s of the target, similar in every band | Within 0.1 s, fairly even | Far above target (lively, blurred dialogue), or treble much lower than the mids (dull, over-damped) |
Volume is length × width × height in metres. The ±0.05 s tolerance applies through the midrange; the standard allows more at low frequencies and at 8 kHz.
4. Early reflections (impulse and ETC)
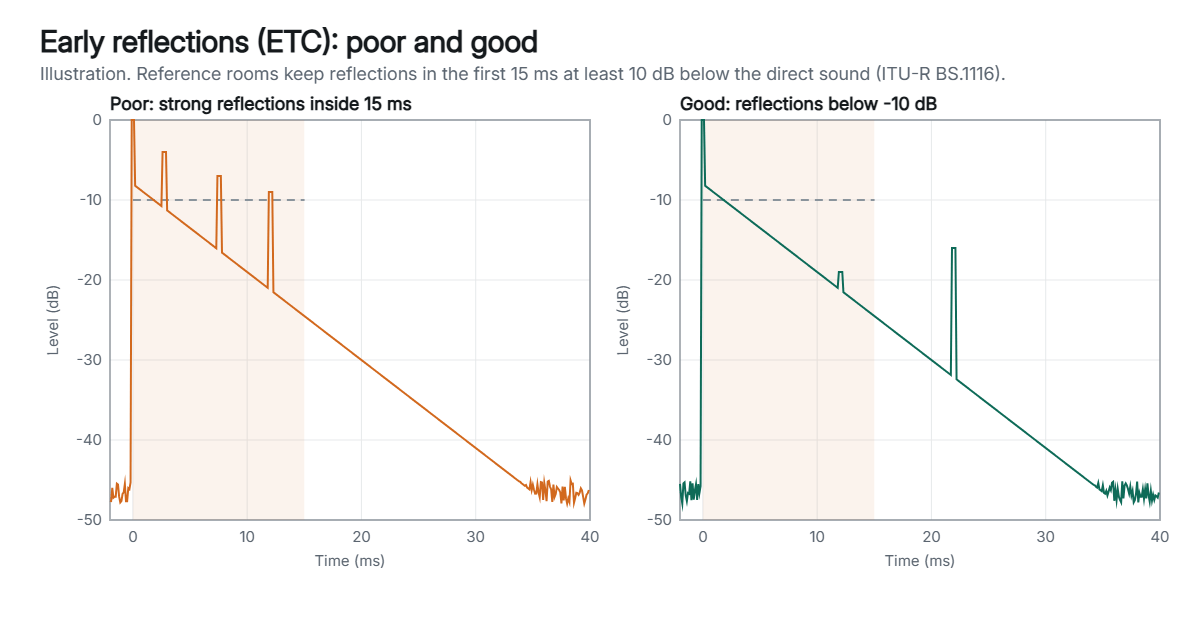
| Good | Poor | |
|---|---|---|
| Reflections in the first 15 ms | At least 10 dB below the direct sound | Within 10 dB of the direct sound |
This is the ITU-R BS.1116 and EBU Tech 3276 rule for reference rooms, measured from 1 to 8 kHz. Floyd Toole’s research found that reflections in small rooms can be neutral or even positive, so treat it as a guide, not a must.
5. Group delay
Published audibility thresholds (Blauert and Laws) are about 3.2 ms at 500 Hz, 2 ms at 1 kHz, 1 ms at 2 kHz, 1.5 ms at 4 kHz and 2 ms at 8 kHz. Later research found smaller thresholds with some test signals. There are no well-researched thresholds for the bass: there, group delay peaks come from room modes, so fix the modes and use the waterfall to judge.
6. Distortion
There’s no standard for in-room distortion. For subwoofers at their maximum output, the CTA-2010 test allows the 2nd harmonic up to -10 dB, the 3rd up to -15 dB and higher harmonics lower still, relative to the fundamental. Research on bass (Fielder and Benjamin) found low bass masks 2nd harmonic distortion far better than 5th, so odd, high harmonics matter most. Treat a sudden jump at one frequency or level as a sign of a rattle or overdriven driver.
Spectrogram: there’s no numeric standard. Read decay times against the bass decay thresholds above.
Next step
Guide 7: Share Your REW Results
Want a second opinion? Export your measurements so others can open them and check your graphs.
Using the benchmarks well
Advanced
- Compare like with like: same mic position, level, smoothing and graph limits for every measurement.
- Judge the bass on several seats, not one. An average across positions shows what most listeners hear.
- A result can miss a benchmark and still sound good. Listen as well as measure.
- Fix big problems first: speaker and sub placement, then treatment, then room correction.
Sources
- ITU-R BS.1116-3 (listening room requirements)
- EBU Tech 3276 (listening conditions)
- Fazenda et al. 2015: perceptual thresholds for room modes
- audioXpress: Toole on the in-room curve
- REW help: RT60
- REW help: Impulse
- diyAudio wiki: group delay audibility (secondary)
- Liski et al. 2021: audibility of group delay
- audioXpress: CTA-2010
- Audioholics: audibility of bass distortion